
Rubber (Natural)
Rubber, known for its elastic quality, is a commodity that is used in many products and applications around the globe (from industrial to household products). There are two types of rubber, to wit natural rubber and synthetic rubber. Natural rubber is made from the juice (latex) of the rubber tree, whereas the synthetic type is made from petroleum. Both types are interchangeable and as such influence each other’s demand; when the price of petroleum rises, demand for natural rubber will increase. But when supply disruptions of natural rubber cause its price to rise, then the market tends to turn to synthetic rubber. This section discusses Indonesia’s natural rubber sector. Indonesia is one of the largest producers and exporters of natural rubber.
The rubber tree needs constant high temperatures (26-32 degrees Celsius) and a wet environment in order to be most productive. These conditions are found in Southeast Asia where the majority of the world’s rubber output is produced. Around 70 percent of global production comes from Thailand, Indonesia and Malaysia.
It takes seven years for a rubber tree to reach a productive age. Hereafter, it can produce up to 25 years. Due to the long cycle of the tree, any short term supply adjustments cannot be made.
Top Five Natural Rubber Producers 2014:
| Country | Production (in tons) |
| 1. Thailand | 4,070,000 |
| 2. Indonesia | 3,200,000 |
| 3. Malaysia | 1,043,000 |
| 4. Vietnam | 1,043,000 |
| 5. India | 849,000 |
Source: Association of Natural Rubber Producing Countries (ANRPC)
NATURAL RUBBER IN INDONESIA
Production and Export of Indonesian Rubber
As the second-largest rubber producer, Indonesia supplies a substantial amount of rubber to the global market. Since the 1980s, the Indonesian rubber industry has been experiencing steady production growth. Most of the country’s rubber output – approximately 80 percent – is produced by smallholder farmers. Government and private estates thus play a minor role in the domestic rubber industry.
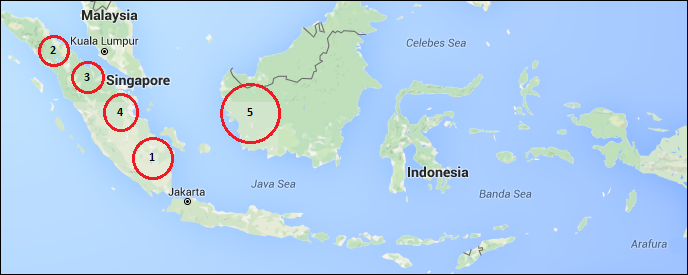
Most of Indonesia’s rubber production stems from the provinces:
1. South Sumatra
2. North Sumatra
3. Riau
4. Jambi
5. West Kalimantan
The total size of Indonesia’s rubber plantation area has risen steadily during the last decade. In 2016, the country’s rubber plantations covered a total of 3.64 million hectares. As prospects of the rubber industry are positive, there has been a shift away from commodities such as cocoa, coffee and tea, in favour of the establishment of palm oil and rubber plantations. Smallholder rubber estates have increased over the past couple of years, while government rubber estates have shown a slight decrease, probably due to their shift in focus to large palm oil estates. Meanwhile, the size of big private rubber estates initially showed a decline between 2010 and 2012 but has started to expand at a fast rate since 2013.
Size of Rubber Estates in Indonesia:
| 2010 | 2015 | 2020 | |
| Smallholder Estates (in thousand hectares) |
2,922 | 3,076 | |
| Government Estates (in thousand hectares) |
239 | 230 | |
| Big Private Estates (in thousand hectares) |
284 | 315 | |
| Total (in thousand hectares) |
3,445 | 3,621 |
Source: Indonesian Rubber Association (Gapkindo)
Around 85 percent of Indonesia’s rubber production is exported. Almost half of export is shipped to other Asian countries, followed by North America and Europe. The top five Indonesian rubber importing countries are the USA (which accounts for almost 22 percent of Indonesia’s total rubber exports), China, Japan, Singapore and Brazil.
Domestic rubber consumption in Indonesia is mostly absorbed by Indonesia’s manufacturing industries (in particular the automotive sector). Considering the country’s manufacturing industry has difficulty to expand significantly, domestic rubber consumption is rising at a slow pace only.
Indonesian Rubber Production & Export:
| 2014 | 2015 | 2016 | 2017 | 2018¹ | 2019¹ | |
| Production (in million tons) |
3.18 | 3.11 | 3.2 | 3.6 | 3.7 | 3.8 |
| Export Volume (in million tons) |
2.62 | 2.63 | 2.58 | |||
| Export Value (in million USD) |
4.74 | 3.70 | 3.37 |
| 2008 | 2009 | 2010 | 2011 | 2012 |
2013 | |
| Production (in million tons) |
2.75 | 2.44 | 2.73 | 3.09 | 3.04 | 3.20 |
| Export Volume (in million tons) |
2.30 | 1.99 | 2.20 | 2.55 | 2.80 | 2.70 |
| Export Value (in million USD) |
n.a. | n.a. | 7.33 | 11.76 | 7.86 | 6.91 |
¹ indicates a forecast
Sources: Association of Natural Rubber Producing Countries, Indonesian Rubber Association (Gapkindo), and Food and Agriculture Organization of the United Nations
Compared to its rubber producing competitors, Indonesia contains a low level of productivity per hectare. This is in large part due to the overall older age of its rubber trees in combination with low investment capability of the smallholder farmers, hence reducing yields. Whereas Thailand produces 1,800 kilogram (kg) of rubber per hectare per year, Indonesia only manages to produce 1,080 kg/ha. Also Vietnam (1,720 kg/ha) and Malaysia (1,510 kg/ha) have higher rubber productivity.
Indonesia’s downstream rubber industry is still underdeveloped. Today, the country depends on imports of processed rubber products due to the lack of domestic processing facilities and the lack of a well-developed manufacturing industry. Little domestic consumption of rubber explains why Indonesia exports about 85 percent of its rubber production. However, in recent years there is a change visible (although a slow one) as exports slightly decline on the back of increased domestic consumption. About half of the natural rubber that is absorbed domestically in Indonesia goes to the tire manufacturing industry, followed by rubber gloves, rubber thread, footwear, retread tires, medical gloves, carpets and other tools.
Indonesia’s Natural Rubber Exports by Type:
| Type | 2010 | 2011 | 2012 | 2013 | 2014 | 2015 | 2016 |
| Concentrated Latex (in thousand tons) |
12.9 | 9.5 | 7.6 | 5.9 | 0.5 | 6.4 | 6.0 |
| Ribbed Smoked Sheet (in thousand tons) |
60.2 | 67.3 | 66.7 | 69.3 | 68.3 | 80.4 | 78.4 |
| Technically Specified Rubber (in thousand tons) |
2,279 | 2,370 | n.a. | 2,625 | 2,550 | 2,539 | 2,494 |
| Others (in thousand tons) |
1.6 | 4.4 | 2.3 |
Source: Indonesian Rubber Association (Gapkindo)
Being the world’s largest rubber importer, policies in China can have far-reaching effects on the global rubber industry. In late 2014 the government of China decided to approve a new standard for compound rubber imports. The permitted crude rubber content in imported compound rubber was cut from 95-99.5 percent to 88 percent, implying that compound rubber imports into China became subject to a 20 percent import duty (the same tariff as natural rubber import duties). China’s new policy is a blow to its rubber suppliers in Indonesia as it results in declining usage of compound rubber in the world’s second-largest economy.
Another problem was that the USA removed Indonesian-made tires from its generalized system of preference. This US program was designed to support developing countries by cutting import duties and taxes for about 5000 products from 123 countries. Indonesian-made tires were removed from the list as the USA believes that Indonesia’s tire industry is already sufficiently competitive. This means that tire exports to the USA are now subject to a five percent import tax.

MARKET TRENDS, CHALLENGES & RUBBER PRICE
A key driver for the global rubber market is the Asia-Pacific region where demand is growing robustly, led by China, the world’s leading rubber consumer that is expected to account for nearly 40 percent of total worldwide rubber consumption by 2021 (mostly used in its tire manufacturing industry). Meanwhile, strong growth in rubber consumption is also expected to occur in Indonesia, India, Vietnam, and Thailand on the back of developing automotive industries in these countries.
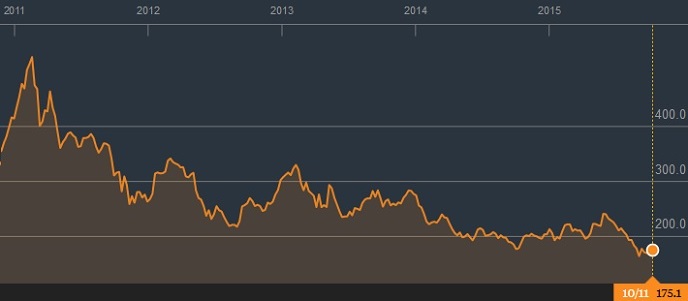
Like most other key commodities, international rubber prices have been under pressure after 2011 amid weak global economic activity (which impacted negatively on the automotive industry) as well as a natural rubber supply glut. Moreover, low crude oil prices made synthetic rubber very competitive, hence the natural rubber price sunk significantly between early 2011 and late 2017. Meanwhile, advances in the development of bio-based tires also pose a threat to the rubber industry.
The first chart below shows the steep decline of the natural rubber price starting from early 2011 due to the rubber supply glut, sluggish economic growth and fierce competition from synthetic rubber.
Rubber Price – 1st Chart (Bloomberg data):
The second chart shows a steep recovery in the natural rubber price in the last quarter of 2017 and start of 2018. The reason behind this price increase are supply disruptions in Thailand. Massive and widespread floods in the southern part of Thailand, where most of the nation’s rubber cultivation takes place, had a big impact on the natural rubber supply (both production and distribution). Severe drought was also cited a reason for weak rubber production in Thailand.
Rubber Price – 2nd Chart (Bloomberg data):

The world’s leading rubber producing nations – Thailand, Indonesia and Malaysia – have also agreed to curtail their rubber exports through the Agreed Export Tonnage Scheme (AETS) in an effort to boost international prices. This first started in late-2012. The decline in Chinese rubber demand is one of the key reasons for implementing the AETS.
Source: https://www.indonesia-investments.com/business/commodities/rubber/item185
